
Overview
This guide shows you how to use the Top Configured Options report to see which options your customers choose most on made-to-order products. It ranks your own configuration options, such as grades, covers and finishes, by dollars and units, and compares them with the same period last year.
Use it to answer questions like "What's our best-selling fabric?", "Which covers sell best in each grade?" or "Which options should we drop?"
Before you start
- Your company must be on the AMP Advanced or AMP Pro plan. This report isn't included in Starter.
- Any user on your account can open the report.
- Your products must be set up with configurable options in AMP, for example, Grade, Cover, or Finish. The report counts options chosen on orders. Standard SKUs without options are left out by default.
- There must be orders placed with those options in the date range you pick.
Open the report
- Sign in to cms.amptab.com. and click Manage
- In the top menu, click Sales Activity. AMP Sales Orders is selected in the left menu.
- Click the Reports tab (next to List View and At a Glance). The Orders By Date report opens by default.
- Open the Choose a Report menu and select Top Configured Options, under Line-item reports.
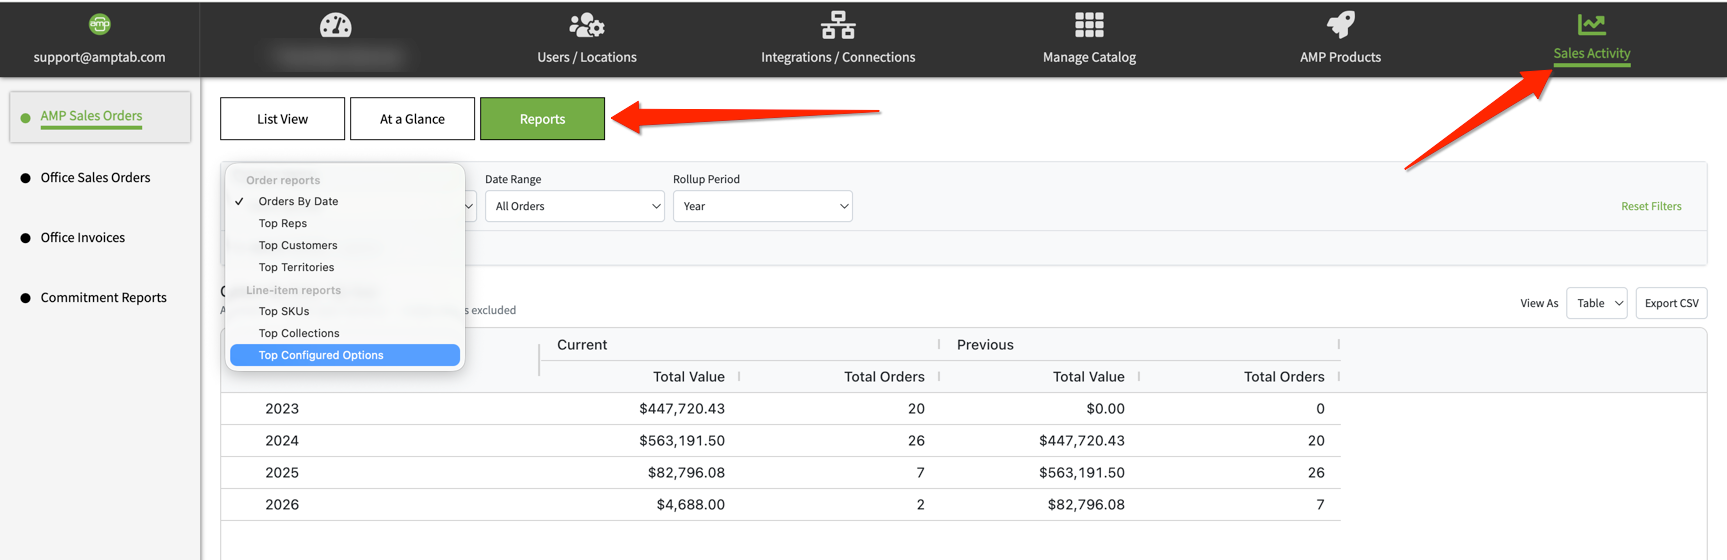
The report opens with All Orders selected and no groupings, so each row is a full product configuration. Adjust it using the steps below.
Tip: The Choose a Report menu has other reports too. Under Order reports are Orders By Date, Top Reps, Top Customers and Top Territories. Under Line-item reports are Top SKUs, Top Collections and Top Configured Options.
Build your report
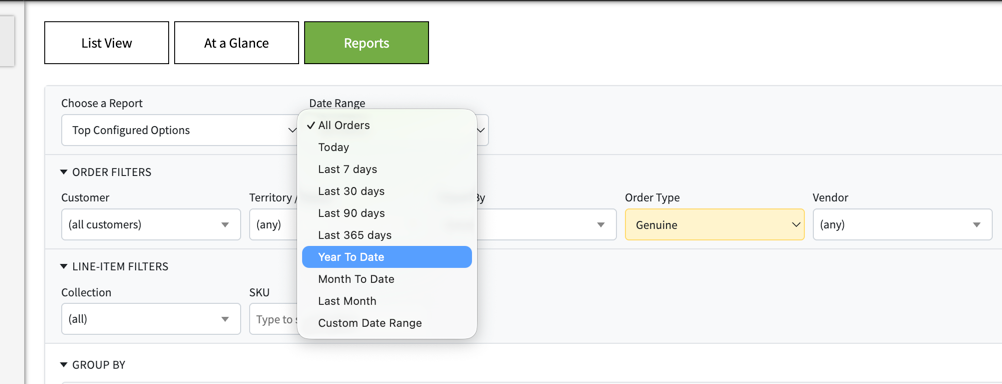
1. Pick a date range
Open the Date Range menu and choose the period to analyze:
- All Orders (default)
- Today, Last 7 days, Last 30 days, Last 90 days or Last 365 days
- Year To Date, Month To Date or Last Month
- Custom Date Range, to choose your own start and end dates
The Previous columns show the same range one year earlier, so you get a year-over-year comparison.
2. Filter the results (optional)
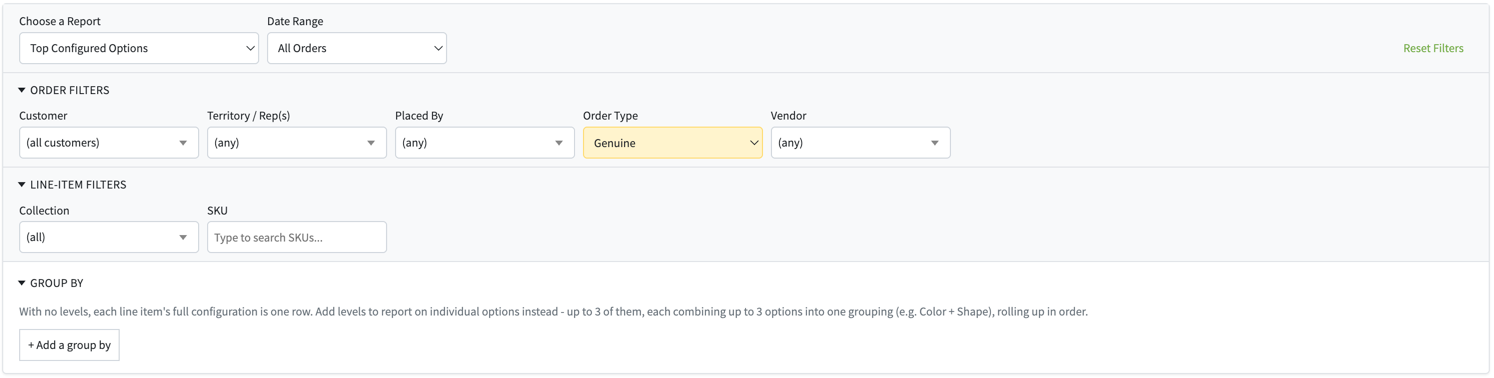
Click Order Filters or Line-Item Filters to open them. The number next to each tells you how many filters are applied.
Filter | Section | Use it to |
|---|---|---|
Customer | Order Filters | Show orders from a specific customer |
Territory / Rep(s) | Order Filters | Focus on a territory or specific reps |
Placed By | Order Filters | Filter by who entered the order |
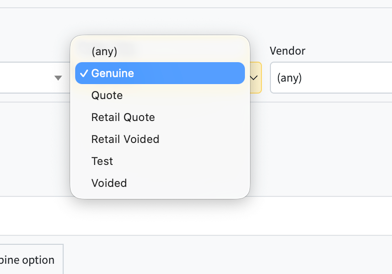
Order Type | Order Filters | Genuine is selected by default. You can also choose Quote, Retail Quote, Retail Voided, Test, Voided, or (any) for all types. |
Vendor | Order Filters | Limit the report to one vendor |
Collection | Line-Item Filters | Include only products from a collection |
SKU | Line-Item Filters | Type to search for and include specific SKUs |
Each menu lists values from your own account: your customers, reps and territories, vendors, collection names and SKUs. The filters in use are summarized under the report title, for example All Orders · Order type: Genuine · empty values excluded.
3. Choose how to group the results
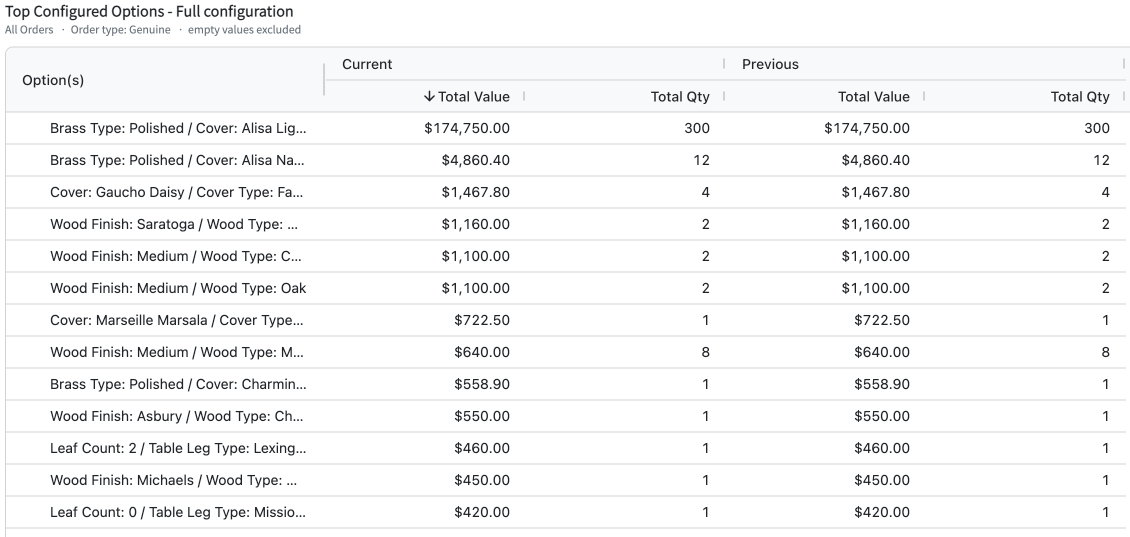
Full configuration (default). With no Group By levels, each row is a complete product configuration, such as Brass Type: Polished / Cover: Alisa Light. This shows which exact combinations sell best. Long names are shortened in the table, and the CSV export has the full text.
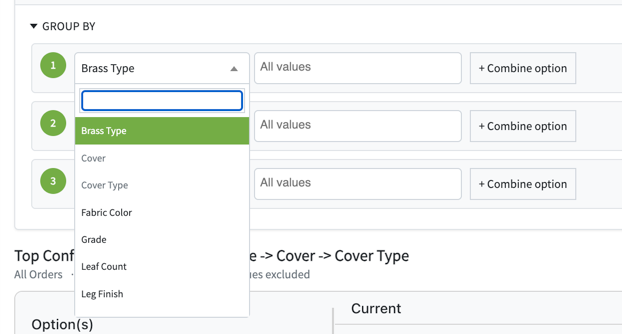
Report on individual options. Click + Add a group by and pick an option, such as Cover. Each row then shows one value of that option, like Alisa Light or Gaucho Daisy, totaled across every configuration it appears in.
The option menu lists the option names from your own product configurations, so your list will look different from the examples here. Type in the search box at the top of the menu to find an option fast.
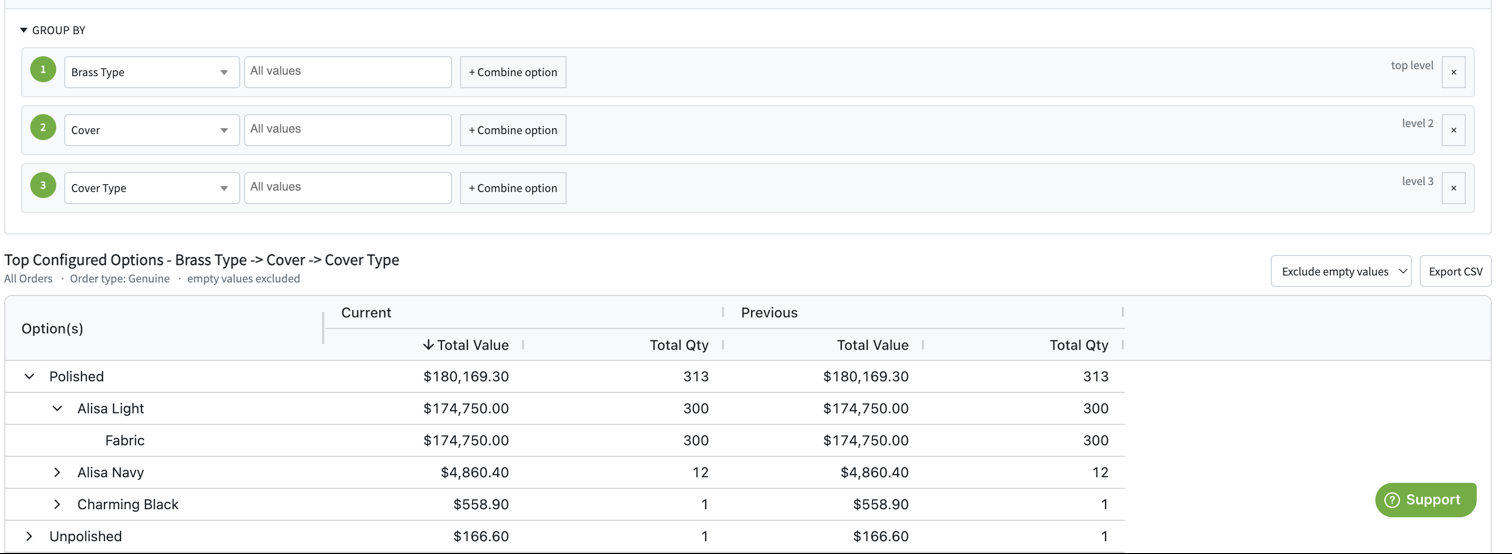
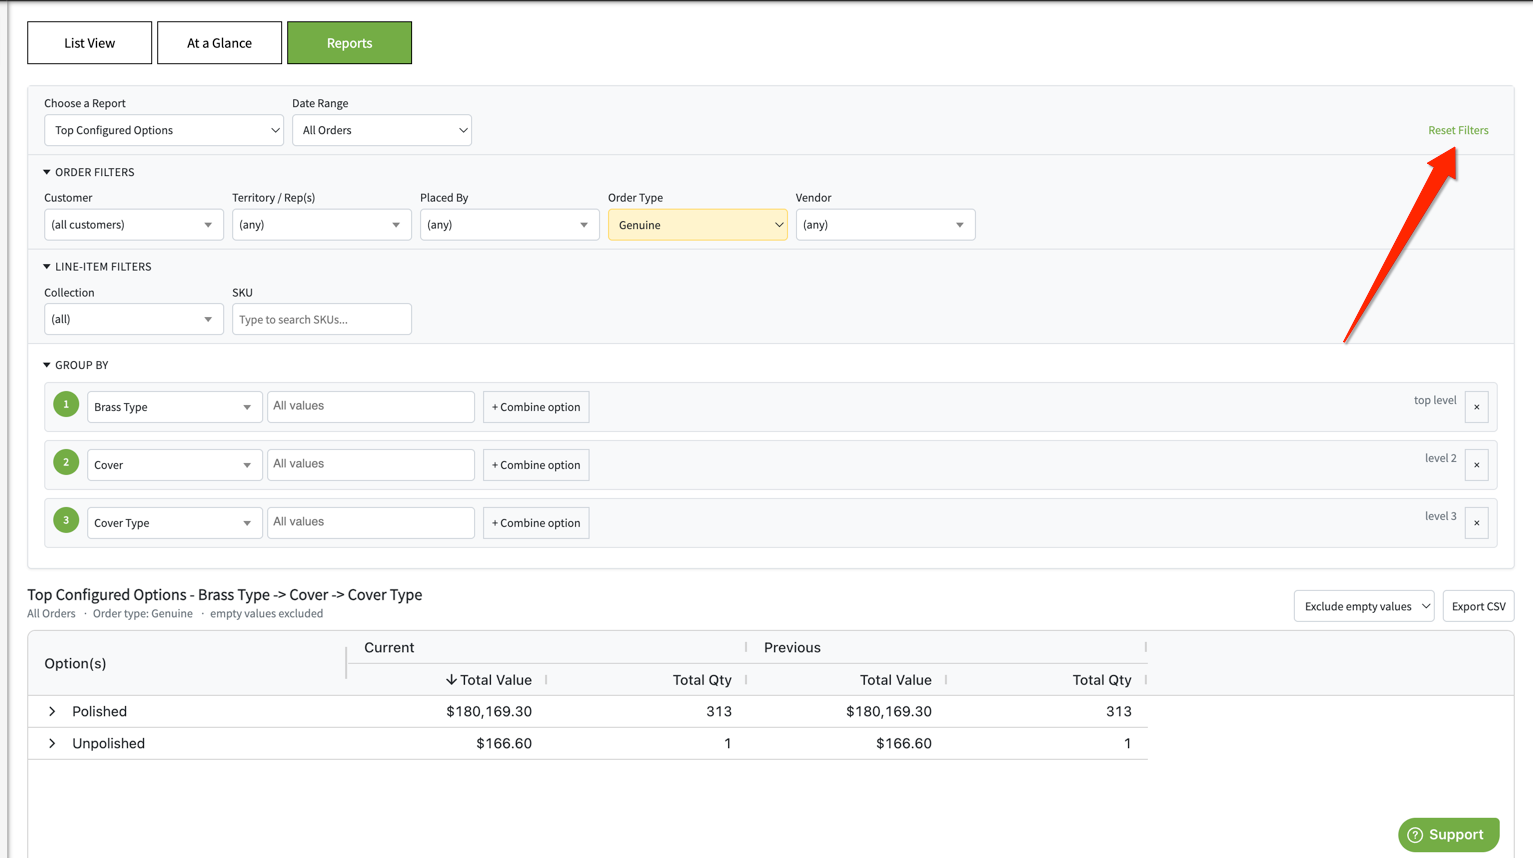
- Add up to 3 levels. Stack them in any order. Each level nests inside the one above it, so the order you choose sets how the results break down. For example, Brass Type → Cover → Cover Type shows each brass finish, the covers sold with it, and each cover's type.
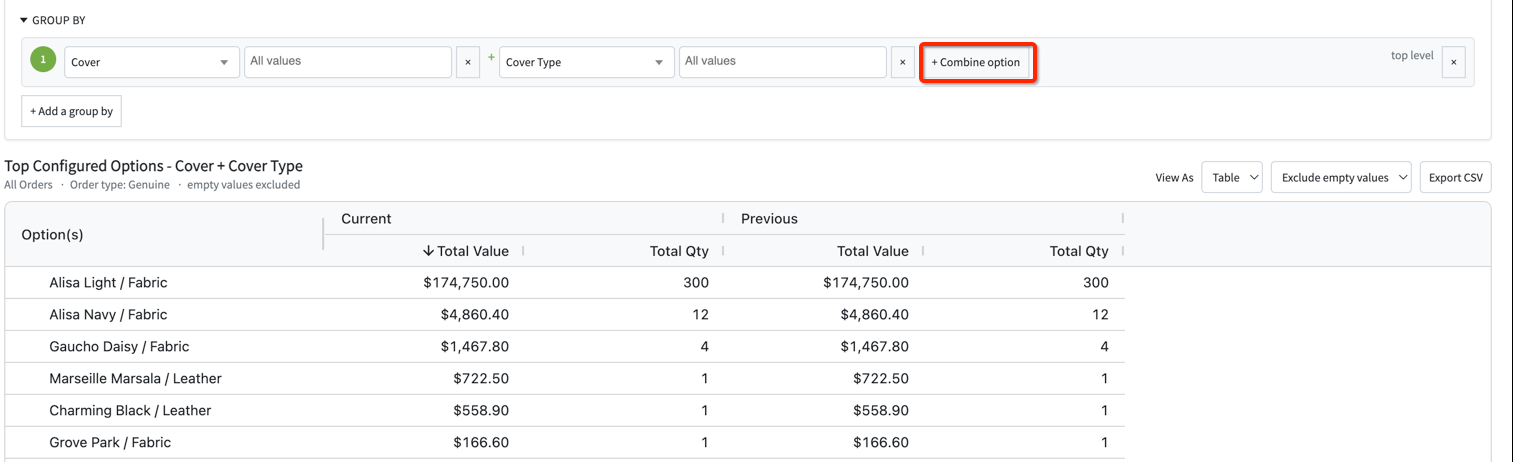
- Combine options in one level. Click + Combine option to join up to 3 options into a single grouping. Each combined option gets its own values box and ×. Each row is then one combination of values. For example, Cover + Cover Type gives rows like Alisa Light / Fabric and Marseille Marsala / Leather.
- Pick specific values. Leave the values box on All values, or choose specific values to show only those.
- Remove a level. Click × at the end of its row. Remove every level to go back to full configurations.
Here, Cover and Cover Type are combined in one level, so each row pairs a cover with its type:
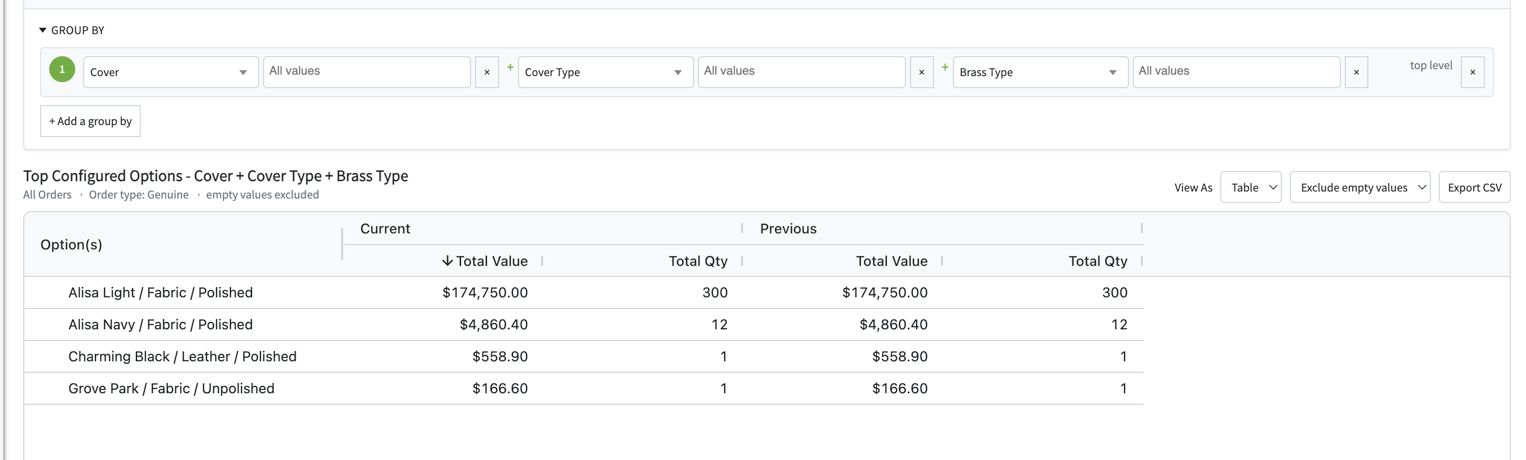
Add a third option and the + Combine option button disappears, because 3 is the maximum. Here Cover + Cover Type + Brass Type gives rows like Alisa Light / Fabric / Polished:
4. Reset
Click Reset Filters at the top right to clear your changes and start over.
Read the results
The results are sorted by Total Value, highest first, so your best sellers are at the top.
Column | What it shows |
|---|---|
Option(s) | The full configuration, or each value of the options you grouped by, such as a cover name or grade |
Current — Total Value | Dollar value of order lines that include this option, in the selected date range |
Current — Total Qty | Number of units ordered with this option, in the selected date range |
Previous — Total Value | Dollar value for the same date range one year earlier, so you can see what's growing or slowing year over year |
Previous — Total Qty | Units for the same date range one year earlier |
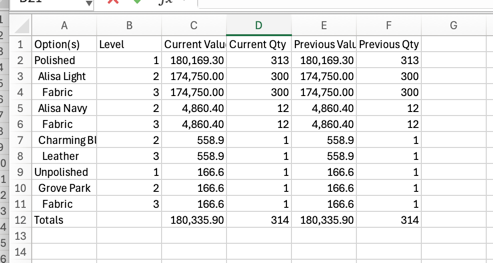
- Expand or collapse groups: with two or three levels, click the arrow next to a row (for example Polished) to show or hide the rows nested inside it. Each parent row shows the total for its group.
- Change the sort: click a column sub-header, such as Total Value or Total Qty, to sort by it.
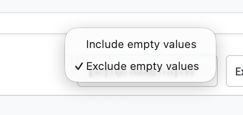
- Include or exclude standard SKUs: Exclude empty values, the default, leaves out line items with no configured options, such as standard SKUs. Choose Include empty values to show them too.
View as a chart or export to CSV
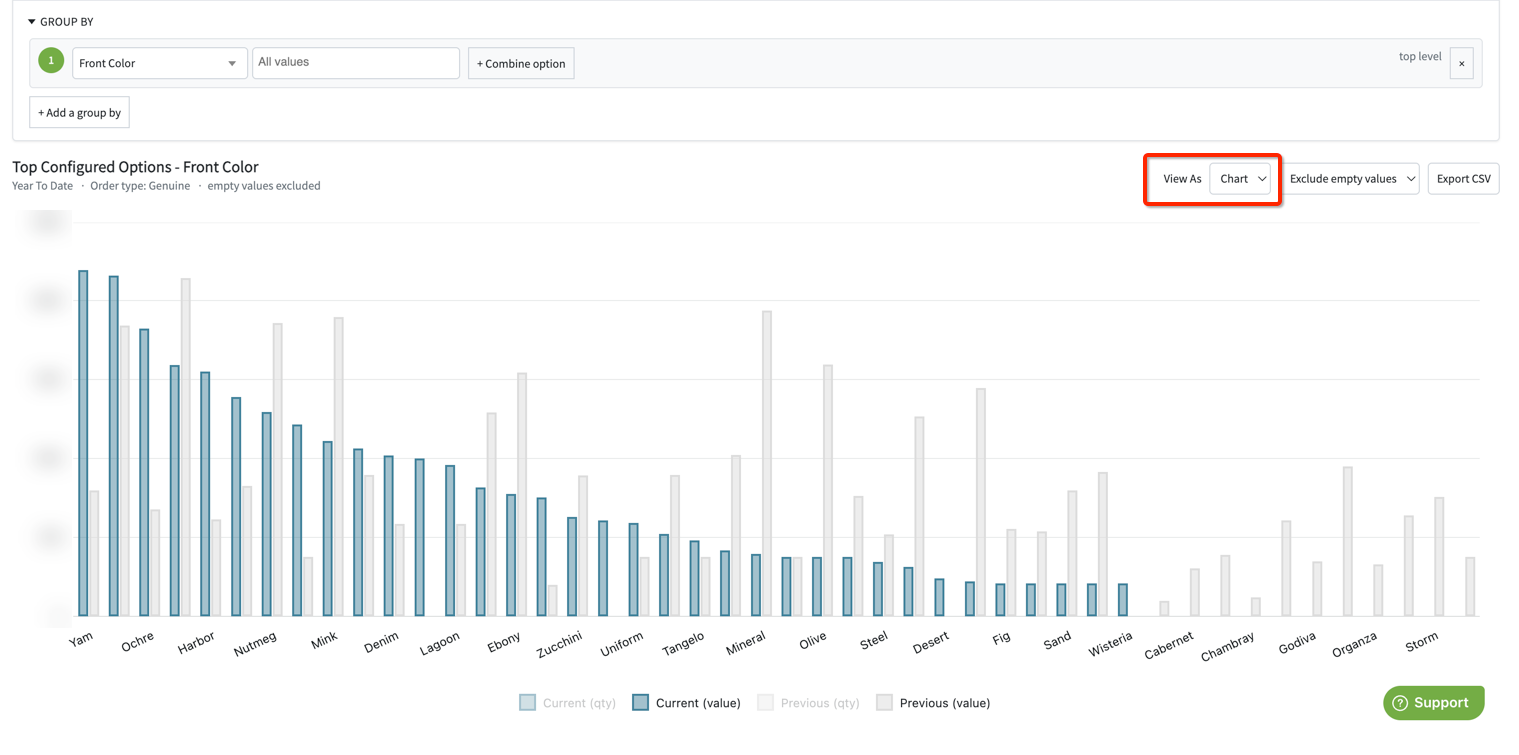
- Chart: set View As to Chart to see the results as a bar chart. Each option gets a pair of bars, this year and the same period last year. Click the legend items (Current (value), Current (qty), Previous (value), Previous (qty)) to show or hide each measure. Set View As back to Table to return. The chart works with one Group By level. With 2 or 3 levels, View As isn't shown and the results appear as a table.
- Export: click Export CSV to download the results with your filters and grouping applied. The file lists every row with its full name. A Level column shows each row's grouping level: 1 is the top level, and 2 and 3 are nested inside it. A Totals row is at the bottom. Open the file in Excel or Google Sheets.
In this example, grouping by Front Color for Year To Date makes trends easy to spot. The best sellers are on the left. A blue bar taller than its grey bar means that color is up from last year, and a shorter one means it's slowing. Colors with only a grey bar sold last year but not yet this year.
Ways to use this report
These examples use common option names. Swap in the names from your own configurations.
Goal | How to set it up |
|---|---|
Find your best-selling fabrics | Group by Cover, sorted by Total Value |
See top covers within each price grade | Group by Grade, then add Cover |
Plan fabric or material buys | Group by Cover and sort by Total Qty for the last season |
Spot options to discontinue | Group by the option and look at the bottom of the list, or rows where Previous is higher than Current |
Prepare for market | Use Custom Date Range for the weeks around your last market. Previous shows the same weeks a year earlier. |
Common questions
- Why are my Current and Previous numbers the same? With Date Range set to All Orders, both columns cover the same orders. Pick a range such as Year To Date to compare it with the same period last year.
- Why don't I see some of my products? Products with no configured options, such as standard SKUs, are hidden while Exclude empty values is selected. Choose Include empty values to see them. Also check your Order Filters and Line-Item Filters.
- An option I expected is missing from the list. Make sure the values box for that group is set to All values, and that no filters are hiding the orders it appears on.
- How many levels can I add? Up to 3 levels, stacked in any order. Each level can combine up to 3 options with + Combine option.
- I don't see Top Configured Options in the Choose a Report menu. This report is only available on the AMP Advanced and AMP Pro plans. To upgrade, contact your AMP account manager or see plans.
- Why do my option names look different from this article? The Group By menu shows the option names from your own product configurations, so every company's list is different.
- Which orders are included? Orders that match your Order Filters. Order Type is set to Genuine by default. To include quotes, test or voided orders, pick that type or choose (any).